How to read a spectrogram
A spectrogram shows time from left to right, frequency from bottom to top and level as brightness. Reading one well comes down to three choices: how long a piece of sound each column analyses, how the frequency axis is spaced, and which levels the colours span. The figures below are for a recording at 48 kHz, the rate most files and microphones use.
Columns, rows and brightness
Each column is one short window of sound split into its frequencies, each row is one frequency band, and the brightness is how loud that band was in that window. By default a window is 2,048 samples: at 48 kHz that is 42.7 ms of sound, and its frequency rows are 23.4 Hz apart.
Windows overlap by 75%, so a new column starts every 10.7 ms. More overlap gives a smoother picture with more columns, but no finer detail: what one column can show is set by the window's length.
Window size: sharp in time or sharp in pitch
A window of N samples at a sample rate f_s lasts N/f_s seconds, and its frequency rows are f_s/N hertz apart. Halving one doubles the other, so no setting is sharp in both. 512 samples last 10.7 ms with rows 93.8 Hz apart: clicks, drum hits and consonants stay crisp, but close tones merge. 8,192 samples last 171 ms with rows 5.86 Hz apart: close tones and the harmonics of a hum separate, but short sounds smear sideways.
The window's shape matters less. Hann, the default, suits most sounds; Blackman–Harris has much weaker side lobes, so a faint tone next to a loud one stays visible, at the cost of slightly wider peaks.
Window length and row spacing by FFT size
| FFT size | 44.1 kHz | 48 kHz | 96 kHz |
|---|---|---|---|
| 256 | 5.8 ms · 172 Hz | 5.33 ms · 188 Hz | 2.67 ms · 375 Hz |
| 512 | 11.6 ms · 86.1 Hz | 10.7 ms · 93.8 Hz | 5.33 ms · 188 Hz |
| 1,024 | 23.2 ms · 43.1 Hz | 21.3 ms · 46.9 Hz | 10.7 ms · 93.8 Hz |
| 2,048 | 46.4 ms · 21.5 Hz | 42.7 ms · 23.4 Hz | 21.3 ms · 46.9 Hz |
| 4,096 | 92.9 ms · 10.8 Hz | 85.3 ms · 11.7 Hz | 42.7 ms · 23.4 Hz |
| 8,192 | 186 ms · 5.38 Hz | 171 ms · 5.86 Hz | 85.3 ms · 11.7 Hz |
| 16,384 | 372 ms · 2.69 Hz | 341 ms · 2.93 Hz | 171 ms · 5.86 Hz |
Each cell: how long the window lasts · how far apart its frequency rows are. An FFT size opens the tool with that window.
Speech, music and short sounds
Speech is commonly analysed in windows of about 20 ms: short enough to hold one speech sound, long enough to separate the voice's harmonics. At 48 kHz the nearest FFT size is 1,024 samples (21.3 ms). A shorter window of 256 samples (5.33 ms, rows 188 Hz apart) blurs the harmonics into broad bands, so the formants, the resonances that make each vowel, stand out instead.
Sustained music and steady hums read best with longer windows, which separate notes and harmonics. Fast birdsong, taps and other quick events need shorter ones; when a sound has both, look at it twice with two sizes.
Brightness is level in dBFS
Levels are in decibels relative to full scale: 0 dBFS is a sine wave at the largest level the file can hold, and everything else is negative. Every 20 dB down is a tenth of the amplitude, and 6 dB down is about half. A 16-bit file spans about 96.3 dB from full scale to its rounding noise, so faint details sit far below the loud ones.
The colours only cover a slice of that range. Auto levels fits the slice to what is in view; setting the darkest level higher hides the noise floor, and setting it lower reveals quiet sounds, together with more noise.
What a level in dBFS means
| Level | Amplitude | Power |
|---|---|---|
| 0 dBFS | 100% | 100% |
| −6 dBFS | 50.1% | 25.1% |
| −12 dBFS | 25.1% | 6.31% |
| −20 dBFS | 10% | 1% |
| −40 dBFS | 1% | 0.01% |
| −60 dBFS | 0.1% | 0.0001% |
As a share of a full-scale sine: amplitude 10^(L/20), power 10^(L/10) at a level of L dB.
Linear, log and mel frequency axes
A linear axis gives every hertz the same height, so the high frequencies take up most of the picture. A log axis gives every octave the same height, like the keys of a piano, which suits music and most natural sounds. The mel axis follows how far apart pitches sound: mel = 2595·log10(1 + f/700), nearly linear at low frequencies and logarithmic higher up. 1000 Hz is 1,000 mel, 4000 Hz is 2,146 mel and 8000 Hz 2,840 mel.
Frequency at each height of the axis
| Height | Linear | Log | Mel |
|---|---|---|---|
| 10% | 2.02 kHz | 39.9 Hz | 307 Hz |
| 25% | 5.02 kHz | 112 Hz | 967 Hz |
| 50% | 10 kHz | 632 Hz | 3.16 kHz |
| 75% | 15 kHz | 3.56 kHz | 8.24 kHz |
| 90% | 18 kHz | 10 kHz | 14.1 kHz |
For an axis from 20 Hz to 20 kHz; the height is measured from the bottom, as a share of the axis.
Shapes to look for
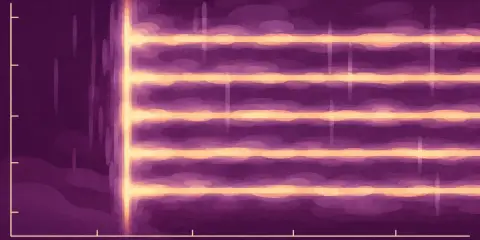
A horizontal line is a steady tone: a whistle, a fan, or mains hum at 50 or 60 Hz and its multiples. A stack of evenly spaced lines is one sound with harmonics, such as a voice, an instrument or an engine, and the spacing is its pitch. A vertical line is a click, a knock or any sudden sound, and a wide grey wash is noise: hiss, wind, rain or traffic.
Lines that bend show a changing pitch. A tone that falls as it passes, fastest at the moment it is closest, is the Doppler shift of a moving source, which the tool can trace and turn into a speed.
The top of the picture: half the sample rate
A recording holds nothing at or above half its sample rate: 24 kHz at 48 kHz, 22.05 kHz for a CD. An empty band above a sharp, flat edge lower than that usually means the file was compressed or the microphone filtered the top away, not that the sound had nothing there.
Highest frequency by sample rate
| Sample rate | Highest frequency | Default window |
|---|---|---|
| 8 kHz | 4 kHz | 256 ms |
| 16 kHz | 8 kHz | 128 ms |
| 22.05 kHz | 11.025 kHz | 92.9 ms |
| 44.1 kHz | 22.05 kHz | 46.4 ms |
| 48 kHz | 24 kHz | 42.7 ms |
| 96 kHz | 48 kHz | 21.3 ms |
| 192 kHz | 96 kHz | 10.7 ms |
| 384 kHz | 192 kHz | 5.33 ms |
The default window is 2,048 samples; at a higher rate it lasts less time.
Sources
- J. O. Smith, Spectral Audio Signal Processing: Classic Spectrograms (CCRMA, Stanford)
- J. O. Smith, Spectral Audio Signal Processing: Spectrogram of Speech (CCRMA, Stanford)
- J. O. Smith, Spectral Audio Signal Processing: Spectrum Analysis Windows (CCRMA, Stanford)
- J. O. Smith, Mathematics of the DFT: Sampling Theorem (CCRMA, Stanford)
Frequently asked questions
Why does my spectrogram look blurry?
Blur sideways means the window is too long for the sound: choose a smaller FFT size. Blur up and down means it is too short to separate the frequencies: choose a larger one. Zooming in on time or frequency also spreads the detail over more of the screen.
Why is there nothing above about 16 kHz in my MP3?
Lossy encoders often cut the top band to save space, and the spectrogram shows the cut as a flat ceiling. The original WAV or FLAC keeps those frequencies, up to half its sample rate.
Is a spectrogram the same as a spectrum?
No. A spectrum is one set of levels by frequency for a stretch of sound; a spectrogram is many of them side by side, one per moment, so you can see how the frequencies change over time.